Spend Visibility tutorial: Filters

Spend Visibility, powered by Amazon QuickSight, allows you to quickly discover purchasing insights and analyze purchasing goals through interactive, visual, out-of-the-box dashboards. It is available for Prime Business Small, Medium, and Enterprise plans
Filters in Spend Visibility allow you to drill down to the details you need, such as PO number, invoice, suppliers, account groups, spend categories, and more. Filters can used to view:
- Spending data for a defined period (Use Order Date)
- Spending for a particular group (Use Group Name)
- Spending for one or more categories (Use Category)
In this tutorial, you'll add an order date, group, and category filter to your Spend Visibility Procurement Dashboard to create a Q1 report for office products.
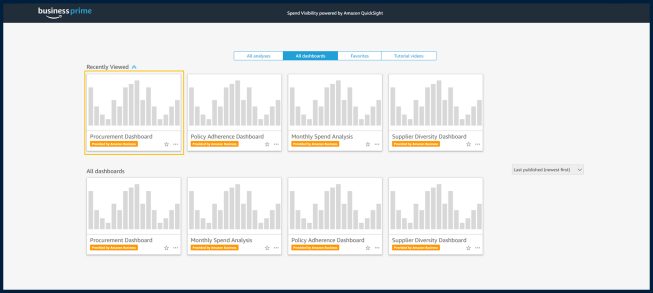
Step 1: Navigate to Spend Visibility and open the Procurement Dashboard
Navigate to the Spend Visibility dashboards. If you need help, check out the Accessing Spend Visibility tutorial. Review the "All dashboards" display. For this tutorial, select Procurement Dashboard. Note that you can use filters in any of your available dashboards.
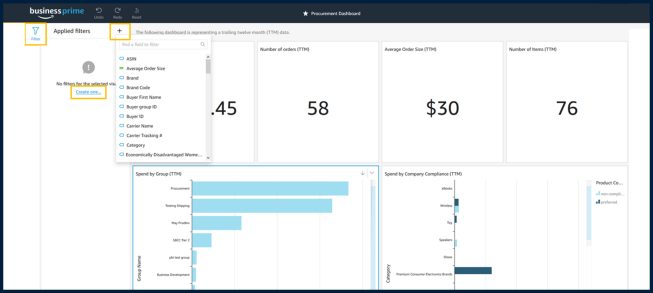
Step 2: Apply the Order Date filter to the Procurement Dashboard
- Click the Filter icon located on the left navigation bar.
- Select a visual on the dashboard and click Create one, OR Click on + sign.
- Select Order Date from the list of filters. The filter will be applied to the selected visual.
- Click on the filter applied to change the filter values.
- Change the Only this visual value to All visuals if you want this filter to be applied to all visuals in the dashboard.
- Select a Start Date and End Date. Under Filter type, select Time Range and Between. In the Start Date box, select January 1, 2020 (or the start of the quarter you want to report). In the End Date box, select March 31, 2020 (or the end of the quarter you want to report).
- Select Apply to apply the filter to the dashboard. Your filter will affect either one or more visuals based on the filter setting Only this visual or All visuals.

Step 3: Apply category filter to the Procurement Dashboard
- Select Category from the list of filters. The filter will be applied to the selected visual.
- Click on the filter applied to change the filter values.
- Change the Only this visual value to All visuals if you want this filter to be applied to all visuals in the dashboard.
- Select the Office Product category to filter the visual by checking the applicable box.
- Select Apply to apply the filter to the dashboard. Your filter will affect either one or more visuals based on the filter setting Only this visual or All visuals.
Congratulations!
You just created filters that let you view only office products for your specified quarter in your Procurement Dashboard. You can adjust these filters, or add new ones, if you want to view by different date ranges, different categories, or combinations of each.
Learn about other things you can do with
Spend Visibility
Was this helpful?